XGBoost for Car Pricing
Gradient-boosted decision tree that predicts used car prices based on features (R² = 0.92).

1. Introduction
Predicting the price of a second-hand car can be a tricky business, but with the help of machine learning and XGBoost, we’re here to make the process way, way easier. There’s no need to rely on chance or intuition when you have a model that can predict prices with a high degree of accuracy at your disposal. Thanks to the power of XGBoost we will learn how to avoid getting ripped off on our next used car purchase in Spain.
You can check the code here.
2. Materials
This project was developed using Python and several popular data processing and machine learning libraries. All the data was obtained through web scraping with the aid of the Beautiful Soup library and was then cleaned, analyzed and merged using pandas and numpy.
Scikit-learn library, TensorFlow and XGBoost were used for building the machine-learning models. These libraries are widely adopted in the field of machine learning and provide a comprehensive set of tools for implementing various machine learning algorithms and techniques.
3. Methods
The data for this project was obtained through web scraping over 350,000 car listings, including their prices and technical features. To improve performance, the “concurrent” library was used to compute functions in parallel, resulting in a speed increase of \(\times10\). The dataset was then cleaned to address missing and incorrectly-displayed values disguised as zeros in order to prevent misleading the model.
After obtaining the data, it underwent a thorough cleaning process. Null and NaN values were removed as it is impossible for any of the features to have a zero value. Categorical features were also unified, such as merging locations by autonomous communities, or specific colors (like ocean blue) to basic ones (blue). Likewise, feature normalization was performed to improve the performance while training the models.
In addition to data cleaning, a visual exploratory analysis was carried out to identify patterns within the data. To train the model, the dataset was divided into three parts: one for training, one for cross-validation (which also allowed for hyperparameter search), and one for testing. Finally, a pipeline was then created that evaluated various models (linear regression, KNN, Random Forest and XGBoost) through cross-validation, which allows us to choose the best one.
4. Visualizations
Exploratory data analysis provides insights and understanding of the underlying patterns and relationships within the data, enabling informed decisions for further analysis and modeling. That is why before building the model, I conducted some exploratory data analysis.
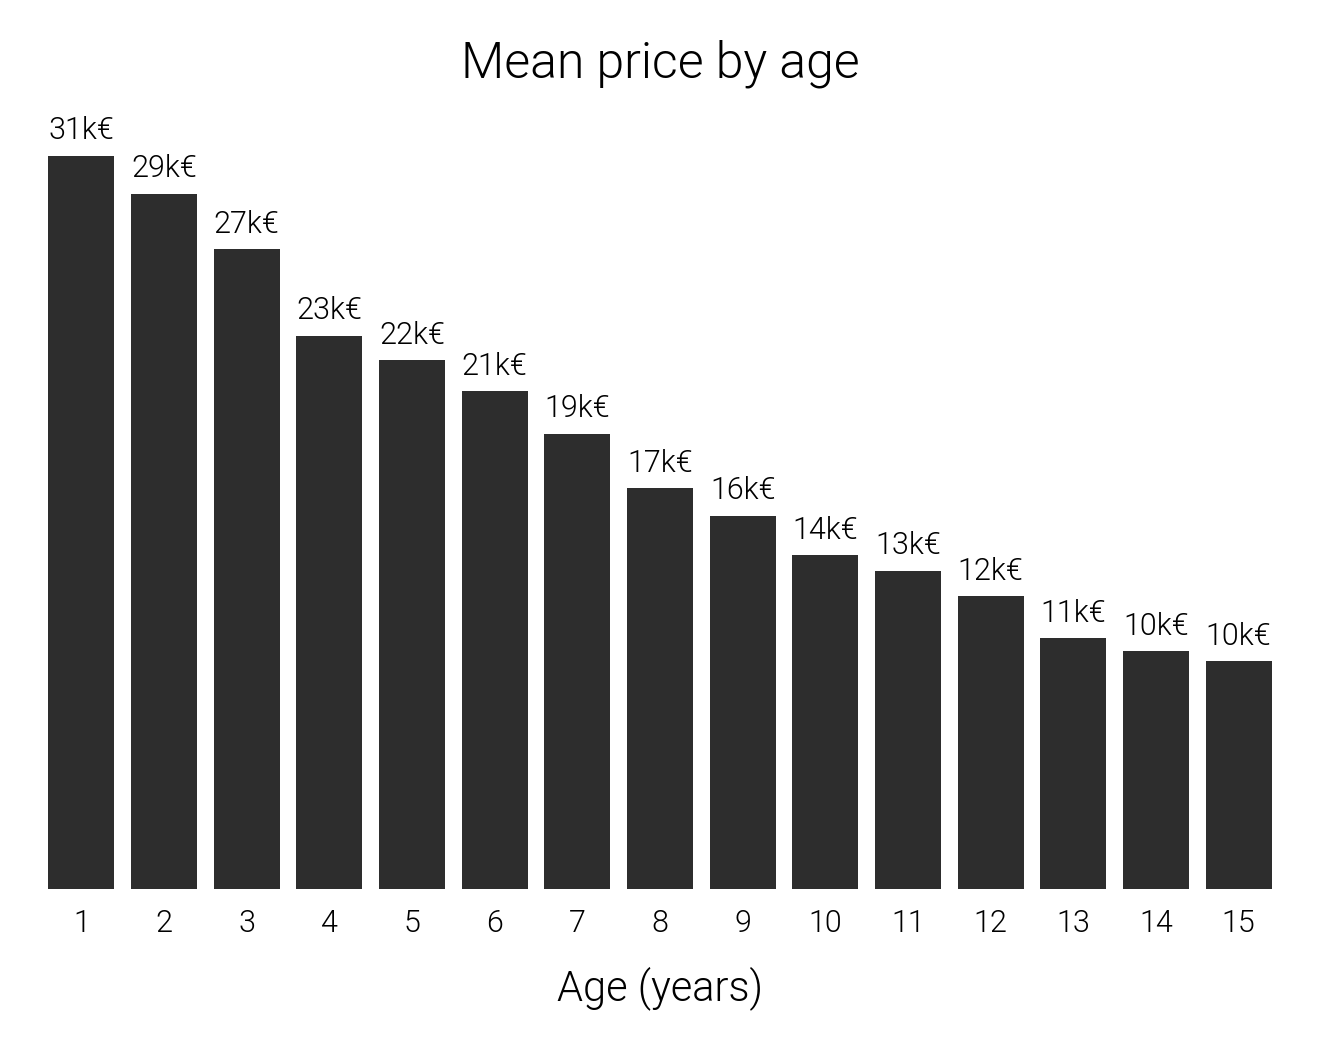
First I did an examination of the devaluation of cars over time. The mean price per age was visually represented in a bar plot, as we can see below:

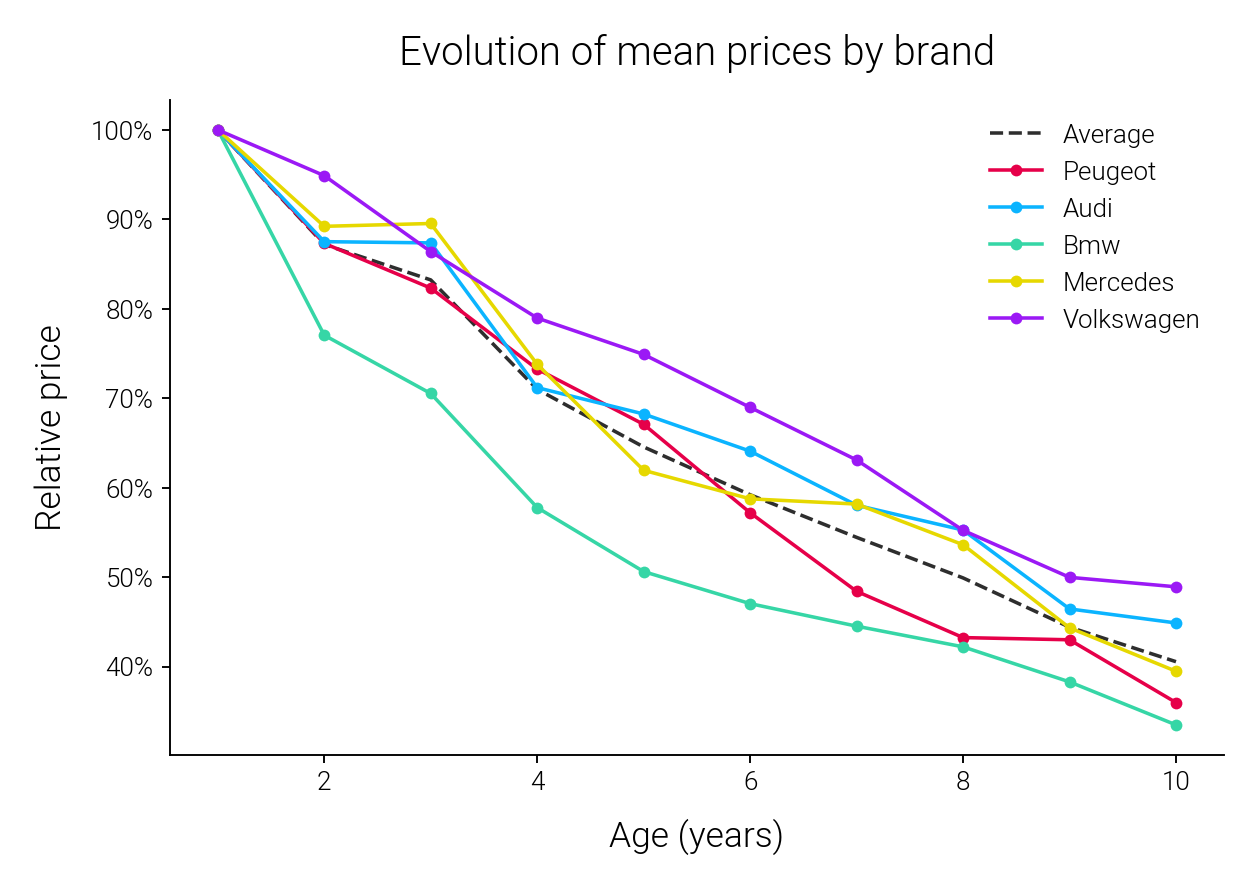
With the insights gained from the bar plot, we can delve into more complex inquiries. For instance, do different car brands experience the same rate of depreciation? Do some brands maintain their value for a longer duration? By aggregating the data, we can uncover the answers to these questions and present them in a line plot, showcasing the top 5 popular brands (although the same can be done for a larger number of brands). The resulting visualization is presented below:

It is evident from the line plot that brands such as BMW tend to experience a faster rate of depreciation, particularly within the first four years. Specifically, a BMW loses more than 40% of its value from year one to year four, while brands like Audi, Volkswagen, and Mercedes may take up to six or eight years to incur the same relative decrease.
To wrap up, I am plotting a final map displaying the regional car prices throughout the country. The prices are not uniform, and you might think that it’s better to buy a car in a low-price zone, but it could also mean that there’s a difference in average quality. These questions are hard to answer without performing a long analysis, however, by using our model we can quickly compare different options and see how it affects the price.

5. Results
The pipeline gave me an initial clue into which were the top models for the project. Next, I selected the best ones and optimized their hyperparameters through a randomized grid search, where XGBoost excelled and emerged as the winner. Its score was comparable to models like Random Forest or the Neural Network, but it boasts greater efficiency and faster training times. The chosen model was then trained and evaluated, providing an estimate of the real error. Specifically, the test data produced a remarkable R2 value of 0.92.
The car price prediction model is now live and ready to assist you in all your car-buying adventures. Try it out!
In conclusion, this project aimed to gather and analyze data on used cars in Spain. The data was collected through web scraping and analyzed using various statistical methods and machine learning techniques. The results showed strong correlation between the price and various features such as age, mileage or horsepowerof the cars. Additionally, the analysis revealed that XGBoost was the best model for predicting the prices. These findings provide valuable insights for both car sellers and buyers on the Spanish market.
6. References
The data for this project was obtained through web scraping from coches.com, a popular Spanish website for buying used cars. The web scraping was performed using the BeautifulSoup and Requests libraries in Python.
7. License
This project is licensed under the MIT License, which permits the use, distribution, and modification of the code and materials with proper attribution and the sharing of any modifications made under the same license.